Thursday, July 31, 2008

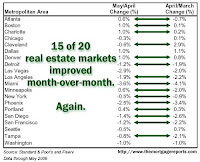
CASE-SHILLER NUMBERS SHOW IMPROVEMENT IN 15 OF 20 MARKETS

For the third straight month, at least 15 of the nation's 20 largest real estate markets showed relative monthly improvement in May 2008, according to the Case-Shiller Home Price Index.

I use "relative monthly improvement" as another way of saying that some of the more distressed markets are "less worse than they were", but that's still good for the housing market (although you wouldn't know it by looking at the headlines).

Now, it's not wrong to look at annual trends in home prices, it's just a little bit misleading. Remember: many home buyers, especially at the lower price points, are seeing something completely different from what the papers are saying they should be seeing.

Year-over-year comparisons are fine for identifying long-term trends, but as it relates to an active home buyer, annual data is more interesting than relevant. It's the short-term trends that matter.

The obvious example: If you've been shopping for an entry-level home over the last 3 months, you have seen a dramatic increase in competition.

When you see "all the good homes" go under contract quickly, it's an affirmation that buyers have got their confidence back. When buyers start to outnumber sellers, that's the moment prices turn around.

In other words, if you're buying a home now, the real estate market of 12 months ago is irrevelant. What you're going to pay for a home is based on market activity today, not activity from 2007.
Wednesday, July 30, 2008

QUICK HITS: CASE-SHILLER SAYS NATION IS DOWN, DENVER IS UP

I have been somewhat critical of the widely followed Case-Shiller housing index in the past because of its tendency to overstate housing market losses based on the index's disproportionate focus on "high end" properties.

In other words, if a $2 million home drops $100,000 in value, Case-Shiller penalizes the entire market in its valuations (and as we can clearly show here in Denver, there is a wide, wide gap between the frenzy at the bottom of the market and the sluggishness at the top).

However, because people are intrigued by this index, let's cite the good news: Case-Shiller reported today that home prices rose a full one percent in Denver between April and May, the largest jump in any of the 20 metropolitan statistical areas the index tracks. Denver home prices had previously risen an additional 0.8% between March and April, according to the report.

Tomorrow, I'll show you the hidden strength inside the Case-Shiller numbers.

Saturday, July 26, 2008

THE BEST RENTAL MARKET IN 20 YEARS - PART FIVE

LIST PRICES ARE ON THE RISE

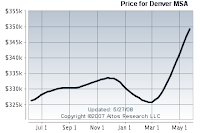
Altos Research, a real estate research firm that advises investors on market conditions around the country, reports that Denver now has the fastest rising list prices in the country.

According to Altos, in May the Denver MSA (metropolitan statistical area) showed an average increase in list prices of 3.7% over the numbers reported for April. Over the past year, Altos says list prices have increased by more than 7%.

So why all the negative reporting?

Despite the case I've made here over the past few days, the fact remains there is still a lot of pain in our market. Private owners (especially those at the lower price points) have had a very hard time competing against banks that have been willing to sell homes for 10 - 20% below market value. We have had nearly 80,000 foreclosures in the past two years. And the memory of being number one in the nation in foreclosures in 2005 and 2006 (when much of the rest of the country was still in "party mode") is still fresh in people's minds.

But times have changed. And those who study the numbers can see it.

We'll wait for the Denver Post to come around. But in the meantime, there is lots of opportunity to be had in the Denver Metro rental market.

Thursday, July 24, 2008

THE BEST RENTAL MARKET IN 20 YEARS - PART FOUR


CASHFLOW IS GREAT - BUT IS NOW A GOOD TIME TO INVEST?

Real estate investors know that cashflow is key to the viability of any investment property. There are also many tax benefits to being a landlord, especially for those investors who are looking for deductions. But is it safe to invest?

Appreciation is one of the most important components of long-term real estate investing.

Nationally, home prices have increased 298% since 1980. In Colorado, values have gone up 263% during the same time, according to the OFHEO (Office of Federal Housing Enterprise Oversight).

So what about now, amid all the negative headlines and gloomy articles about the national housing market?

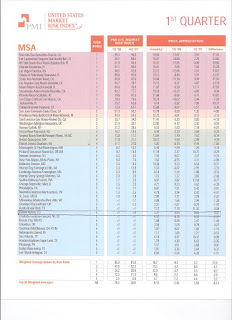
The PMI Group, one of the largest mortgage insurance companies in America, puts together a quarterly analysis of the top 50 markets in the country, ranking them in terms of risk.

The riskiest market in the country today, according to PMI - Riverside, California, with a 95.5% likelihood of decreasing values over the next two years.

PMI breaks these top 50 markets into five segments, with "Level 1" representing the riskiest markets and "Level 5" showing the safest markets. The Denver region is currently in the lowest risk category, with a "less than 1% chance" of decreasing prices over the next two years.

Positive cashflow, rising rents and an occupancy rate of over 97% are incentive enough for most real estate investors to jump into this market. PMI's optimistic outlook for Denver is just an added bonus in making the case for why this is one of the best rental markets in memory.

Tuesday, July 22, 2008

THE BEST RENTAL MARKET IN 20 YEARS - PART THREE

MONTHS INVENTORY CLEARLY SHOWS THE HOTSPOT IN OUR MARKET

In real estate lingo, "months inventory" can be described as the time it would take to sell all homes on the market in a specific price range if no new homes were to come on the market.

For example, if you had 1,000 homes on the market and 100 of them had gone under contract in the past 30 days, you would have a 10-month inventory of homes (1,000 divided by 100).

As of this morning, here's what the inventory of homes looks like at different price points in the Denver MLS:

$0 - $250k... 3.54 months of inventory
$250k - $400k... 6.96 months of inventory
$400k - $600k... 10.82 months of inventory
$600k - $1M... 24.12 months of inventory
$1M - plus... 41.57 months of inventory

Most analysts say that a six month inventory of homes represents a "balanced" market. Anything above that number represents a buyer's market, below that number is a seller's market.

So what do you see with these numbers?

It's immediately apparent that the big change in our market is the rapid burn-off of foreclosure inventory at the bottom of market, while homes at higher price points are simply not moving... yet.

Not only are foreclosures dropping, but buyers and investors are now fearlessly diving into this segment of the market. I have commented repeatedly over the past few months about the intense competition for well-priced foreclosures. Both investors and first-time buyers can plainly see the benefit of owning when rental properties cashflow and mortgage payments are more affordable than rent.

Make no mistake... there is still pain in our market, and there are still more foreclosures to come. But they are no longer coming in the overwhelming numbers we have seen, and prices have reached a point where buyers have regained their courage.

If the President signs the housing bill being pushed through Congress at the moment, which includes a tax credit of up to $7,500 for first-time buyers through June of 2009, you'll see even more activity at the lower price points in our market.

Sunday, July 20, 2008

THE BEST RENTAL MARKET IN 20 YEARS - PART TWO

INVENTORY CONTINUES TO FALL THROUGHOUT DENVER METRO AREA

If you have tracked the monthly inventory reports I post on this blog, you probably have observed the following trend: the inventory of active homes is falling at a farily dramatic pace.

Check this out (combined SFRs and condos):

FEB - 25,037 homes on the market... a 1% increase from February of 2007
MAR - 25,516 homes on the market... a 3.5% decrease from March of 2007
APR - 26,171 homes on the market... a 6.0% decrease from April of 2007
MAY - 26,333 homes on the market... a 9.5% decrease from May of 2007
JUN - 26,014 homes on the market... a 14% decrease from June of 2007

If you just look at condos, inventory is down 23% from one year ago!

What's happening here? Nationally, the housing market is in a funk and values continue to erode. But in Colorado, where the foreclosure tsunami hit first, it certainly appears we have leveled off and are on the way back.

Tomorrow, we'll take a look at where the activity in our market is taking place.

Saturday, July 19, 2008

THE BEST RENTAL MARKET IN 20 YEARS - PART ONE

HOMEOWNERSHIP RATE IS DECLINING

In the 40-year period between 1955 and 1995, the homeownership rate in America averaged 61%, meaning that 61% of households owned and 39% rented. In the 10-year period between 1995 and 2005, however, the national homeownership rate surged to 69%, meaning just 31% of all households were renting.

Good time to be a landlord? Uh, no.

As you know, the great housing boom in America started in the mid 1990s and ended in 2006. During this time, underwriting guidelines became looser and looser, as lenders became immune to risk because rising values made everyone seem creditworthy.

Now, as the housing market pushes back against 10 years of gains, the homeownership rate is on the decline.

In 2006, the homeownership rate retreated to 68%. Last year, it went to 67%. Today, many analysts predict that by the time our national foreclosure crisis is over, homeowernship rates will be back in line with historical averages.

In the past two years, nearly 80,000 Colorado households have been converted from owners to renters through the foreclosure process. Single family rental homes currently have a vacancy rate of 2.7% in the Denver Metro area. Rents are very much on the rise.

With an unemployment rate a full percent below the national average and very little new construction on the horizon, the demand for quality rental housing will only intensify in the years ahead.

It's a landlord's market, plain and simple.

CLIENT APPRECIATION PARTY RECAP

Just a quick note of thanks to everyone who joined us last night in Arvada for our 2008 Summer Client Appreciation Party at the Festival Playhouse Theatre.

We saw John Patrick's acclaimed comedy "A Bad Year for Tomatoes", and while I'm not sure I appreciated theatre owner Charlie Ault wrapping my name into the screenplay (the dubious "Becker Boy" references made the audience laugh, but I winced), it was all in good fun and I'm sure I'll forgive him sooner or later.

It was a great night and a lot of fun, and I look forward to putting another event together to express my thanks for your ongoing support and steady stream of referrals. My thanks go out to Charlie Ault and everyone at the Playhouse who put on a great show. Let's do it again soon!

Saturday, July 12, 2008

BOOK REVIEW: "THE PURSUIT OF WOW!"

I'm currently reading "The Pursuit of Wow!" by Tom Peters, a book that was recommended to me a few weeks ago by Chuck Bode at my most recent CRS conference.

One of the recurring themes in the book is to be continually prepared to change and evolve. Nothing stays the same.

In our market, the vast majority of the sales activity right now is below $250,000. While there's a six week inventory of foreclosures homes on the market, there is a three-year supply of homes priced above $1 million. Thus, I have spent a lot of time this year with investors and first-time buyers, who are the prime beneficiaries of the conditions that currently exist.

Working with clients is an experience, not an event. It's an experience for them, and it's an experience for me.

In Peters' language, the goal of the sales professional is to "Amaze, Amuse, Surprise and Delight" our clients. We are engaged in the very serious business of buying or selling shelter, but along the way we can have a little fun.

There are 1.2 million Realtors in America today. There are over 40,000 in Colorado. My goal is to treat my clients in such a way that when they think of real estate, they think of only one name: mine.

Thursday, July 10, 2008

JUNE METROLIST STATISTICS


THE MARKET
Active Homes on the Market as of 6/30/08: 26,104
Active Homes on the Market as of 6/30/07: 29,685
Change: - 13.72%

Homes Under Contract as of 6/30/08: 6,308
Homes Under Contract as of 6/30/07: 6,137
Change: + 2.80%

Homes SOLD in June 2008: 4,845
Homes SOLD in June 2007: 5,087
Change: – 5.54%

WHAT IT MEANS
Interesting trends continue.

On the street, here's what I see. There are basically four levels to our current market:

1) Foreclosures and short sales;
2) Privately owned entry level and starter homes;
3) Traditional “middle class” neighborhoods;
4) High end homes and estate properties

Average “market time” for each of these types of homes is radically different. With 80% of foreclosures listed at $240,000 and below, there has been an abundance of homes on the market at the lower price points. For private owners, competing with banks (which discount heavily on their inventory) is difficult, but not impossible. Purchase activity on foreclosures has soared since March, with multiple offers and above list price offers becoming normal as investors and first-time buyers compete for discounted properties.

The middle of our market is doing better than most people realize. In fact, average market time for homes in the $300k-$399k price range has fallen to 4.55 months (down from 6 months in January), which technically can be defined as a sellers’ market.

At the higher price points, inventory is tougher to move, mostly because of tighter credit and underwriting guidelines. However, prices are stable… it just takes patience, pricing and a whole lot of promotion to achieve your desired result. As more homes sell in the middle of our market, demand at the higher price points should also increase.

Last month, I posted a chart in my monthly summary showing what's happening with the inventory of homes. June was our fifth consecutive month of reduced inventory and rising list prices... that constitutes a trend, my friends.

For single family homes, the year over year inventory trend looks like this:

FEB: 4.21% MORE homes on the market than one year earlier
MAR: 0.02% FEWER homes on the market
APR: 2.07% FEWER homes on the market
MAY: 5.66% FEWER homes on the market
JUN: 10.70% FEWER homes on the market

For condos, the trend is even more pronounced:

FEB: 8.73% FEWER condos on the market than one year earlier
MAR: 13.16% FEWER condos on the market
APR: 17.13% FEWER condos on the market
MAY: 20.50% FEWER condos on the market
JUN: 22.51% FEWER condos on the market

This huge drop in inventory, especially among condos, is happening at the lower price points in our market. Basically, it’s less foreclosure inventory.

Days on market for SOLD homes has fallen from 111 for single family homes in February to 94 today, and from 123 for condos in February to 108 today.

Right now, your approach to this market is going to depend on which market you are in. Foreclosure buyers are living in a very different reality from high-end sellers. Banks are raising list prices while traditional mid-range sellers still must cut price to compete. But things are starting to balance out.

To continue this positive trend, we need stability in the credit markets and enough consumer confidence so that buyers don't lose their resolve. We've got good fundamentals working right now... the goal is to keep moving foward.

Tuesday, July 8, 2008

"WE BUY UGLY HOUSES... IN DENVER"

The billboards get noticed. My kids think they're cute. In fact, you've seen them around town for years. "We Buy Ugly Houses".

That's HomeVestors, a 260 office national real estate franchise which buys distressed properties in markets around the country and resells them to investors, flippers and rehabbers.

HomeVestors just released its 2008 list of the "Top 10 Markets for Investing", with Denver checking in at #4. Here's the list:

1. Dallas
2. Houston
3. Atlanta
4. Denver
5. Fort Worth
6. San Antonio
7. Charlotte, NC
8. St. Louis
9. Milwaukee
10. Chicago

When it's cheaper to own that to rent... when vacancy rates for single family rental properties are less than 3%... when the state's unemployment rate is more than 1% below the national average... when active inventory has fallen for five straight months (now nearly 14% below one year ago) and when "days on market" has fallen 13% in six months... why WOULDN'T you be on this list?

Now is the time for investors in Denver.

Tuesday, July 1, 2008

FOUR STRAIGHT MONTHS OF RISING HOME PRICES NATIONALLY

While the financial world is focused on poorly underwritten loans and sinking corporate earnings, the nation's housing market is now quietly in its fourth month of a significant rally.

According to new NAR statistics, the median home price nationally has risen to $208,600, up 6.6% (or about $13,000) since February. Another indicator, the mean home price (otherwise known as the average home price), has also shown strength and has risen from a low of $242,000 in February to $253,100 in May, a rise of $11,100 or 4.5%.

Altos Research reported that Denver had the fastest rising list prices in the country in May, jumping by 3.7% over April. Chalk it up to fewer foreclosures and significantly higher demand for those discounted homes on the market.

Lowballing the bank is out. Multiple offers are in. For informed and decisive home buyers, great deals still exist. For the indecisive and the ill-informed, frustration awaits.

In this market, foreclosure buyers need to be preapproved in advance, clear about what they want and prepared to take action immediately.